SpectraScope
Interactive interface to visualize spectra and filter sets for any microscope. Easily customizable.
The idea behind SpectraScope is to provide users with an easy-to-use web-interface (that can be directly downloaded and run locally) where to visualize fluorophores and microscope filter sets of interest. This can be invaluable when setting up new optical configurations or designing new microscopy-based experiments.
SpectraScope is available both as a webpage and as an ElectronJS-based app. You can choose your flavor and download it from the releases page.
Notice! The webpage interface has been developed for GoogleChrome (v74) and FireFox (v66). Thus, it may not be fully compatible with other browsers (e.g., Safari, IExplorer,…).
Live demo
A live demo of SpectraScope webpage is hosted on github, click on the screenshot below to access it.
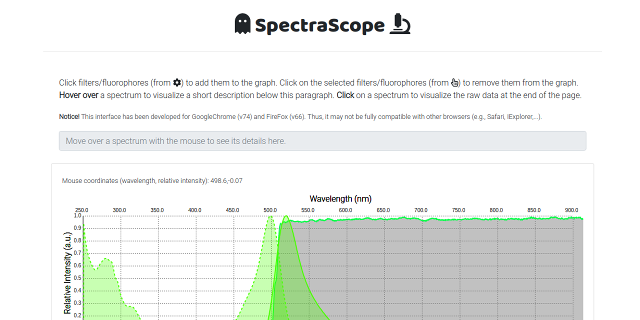
Features
For both webpage and webapp
- Visualize excitation/emission spectra of any fluorophore of interest in the 250-900 nm range. The fluorophore color is automatically selected based on the emission peak in the visible range by using the wave2color functions.
- Visualize the transmission spectrum of any filter or dicroic mirror of interest, overlayed to the fluorophore spectra.
- Visualize the intensity spectrum of any light source of interest, overlayed to the fluorophore spectra.
- Explore the spectra with the mouse, seeing the precise relative intensity and wavelength of any point of interest.
- Quickly see a brief description of any spectrum by hovering over it with the mouse, and access the raw data by clicking on them.
For webapp only
- Manage your own settings template, including microscopes, light sources, optical elements, and fluorophores directly through the interface.
Installation
Download your flavor of choice (webpage or webapp) for your Operating System from the releases page.
Known issues
webpage
Please, notice that GoogleChrome does not allow crossorigin requests from local files (i.e., when the address starts with something like file:// or C:/). Thus, when opening SpectraScope locally, we recommend either using Mozilla FireFox or installing this tool on an Apache Server.
Usage
- Click on the sources/filters/mirrors/fluorophores (from the Input panel) to add them to the graph.
- Click on the selected filters/fluorophores (from the Selected panel) to remove them from the graph.
- Hover over a spectrum to visualize a short description below this paragraph.
- Click on a spectrum to visualize the raw data at the end of the page.
More info are available in our Wiki!
Contribute
We welcome any contributions to SpectraScope. Please, refer to the contribution guidelines if this is your first time contributing! Also, check out our code of conduct.
License
MIT License
Copyright (c) 2019 Gabriele Girelli