ifpd
iFISH probe design
View the Project on GitHub
View the Project on PyPI
ggirelli/iFISH-probe-design (2.0.4)
Content
ifpd web interface
A brief description on how to run the interface with ifpd_serve is available in the corresponding page page.
Additionally, some examples are also available here.
The interface is fully responsive, and can be visualized with a display of any size or aspect ratio. Still, we suggest using a large enough display to properly visualize details in some plots without having to download them or zomm in.
Content
Homepage
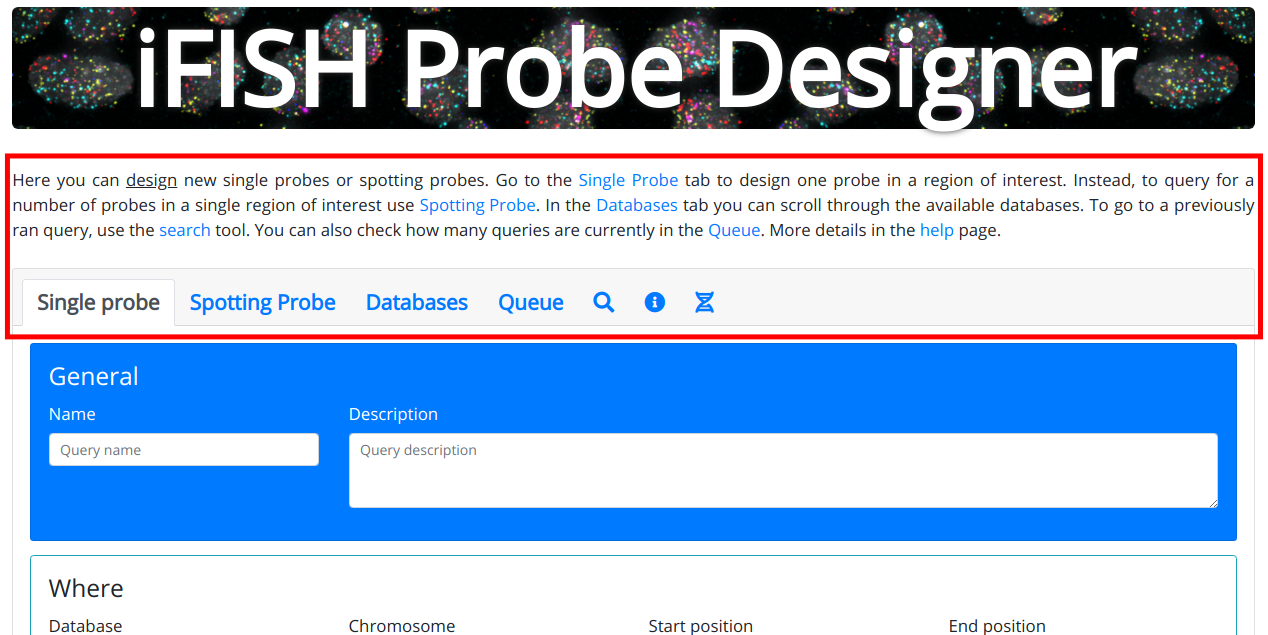
The homepage starts with a big header banner with the text iFISH probe designer, immediately followed by a small disclaimer text and then by the main interface body (red bounding box in the screenshot).
The main interface body is divided in 5 main tabs, plus two additional buttons:
- Single probe contains the form to design a single probe.
- Spotting probe contains the form to design a spotting probe.
- Databases shows details regarding the currently available databases.
- Queue shows the queue status and whether there are queries waiting to be executed.
- Search () allows to input a query ID to return to the corresponding query page. An “Error 500” message is shown if the specified query ID does not exist.
- Help () redirects to this page.
- Genome Browser () redirects to the UCSC genome browser. This can be useful to obtain the coordinates of genes or other genomic regions of interest.
More details on each tab in the corresponding sub-sections below.
The footer of the page reports the version tag and copyright details. When visiting this documentation, always check that the version tags match!
Single probe
The single probe design form is divided into four main areas (or “cards”).
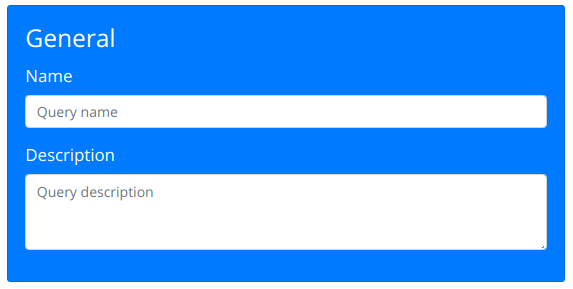
The General card (light-blue background) asks for a name and a description for the query. These are both optional and provided for your convenience to remember the details (e.g., purpose, experiment,…) of your query.
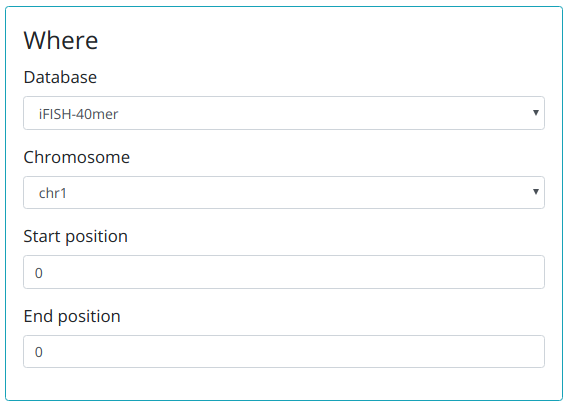
In the Where card, you can select the database from which to retrieve the oligos and your genomic region of interest.
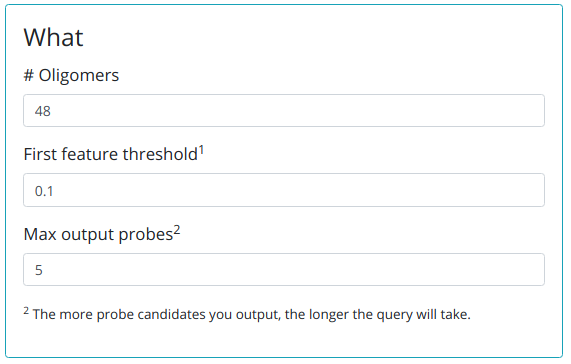
In the What card you provide the number of oligonucleotides you want to have in your probe, the fraction (F) that the algorithm should use for the filter step, and how many probes you want in output (set to -1 to obtain all possible candidates).
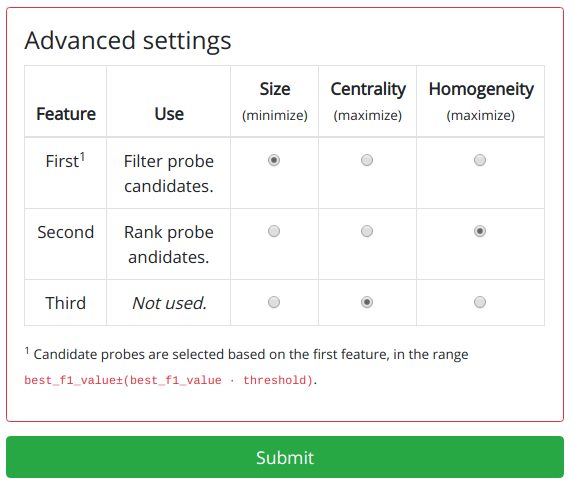
In the Advanced settings card you can specify the priority of the three single probe features. For more details on how this is used, check the algorithm or the example pages.
Finally, the big green “submit” button sends the form information to the server, that places the query in the queue and redirects you to your query page.
Spotting probe
The spotting probe design form is identical to the single probe, with only one difference.
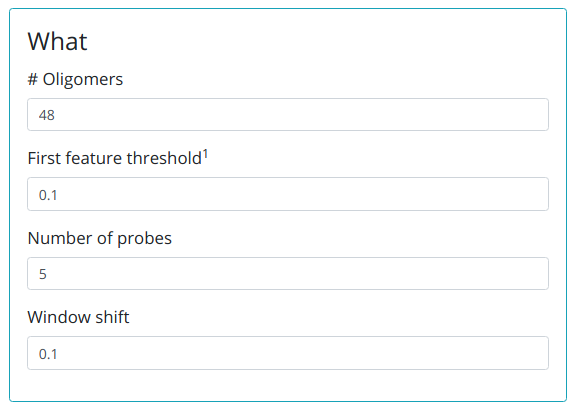
In the What card, the Max output probes field is replaced by the two fields, where you can specify the number of iFISH probes you need for the spotting probe, and the window shift (W). For more details on how this is used, check the algorithm or the example pages.
Query page
The query starts with a big header banner with the text Query.
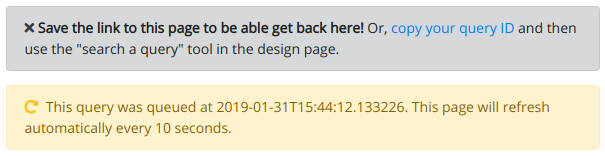
Then, a gray alert is shown, recommending to either save the link to this page, bookmark it, or note down your query ID. You can use the link to the query page to get back to it, or use the query ID to get back there using the search tab in the homepage. You can copy the query ID simply by clicking on the “copy your query id” link. To hide this message click on the black cross () on the left.
Then, if the query is not processed immediately but queued instead, a yellow alert reports the queuing time. The page keeps refreshing automatically every 10 seconds while the query is in the queue. If this does not happen, you can do it by clicking on the refresh () icon on the left.
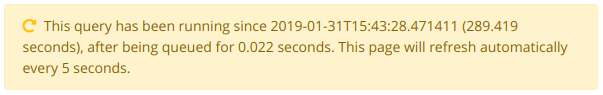
When the query leaves the queue, the yellow alert changes to report the processing time. At this stage, the page keeps refreshing automatically every 5 seconds. If this does not happen, you can do it by clicking on the refresh () icon on the left.
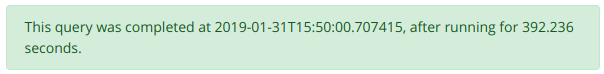
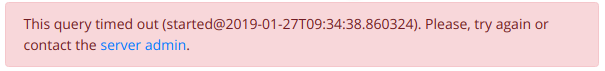
Once the query is processed, the alert turns green and reports the time at which the query was completed, alongside the running time. If something wrong happened during the processing, or if the query took too long, the alert turns red and invites the user to try again or contact the server admin.
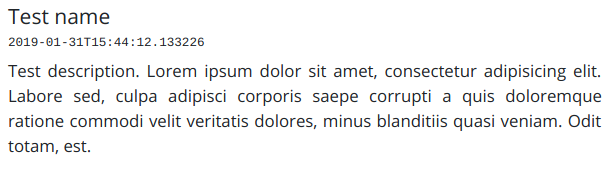
Right after the query status alert, some info are reported: query name, time of submission, and description. Given that query name and description are optional, sometimes only some of these information are reported.
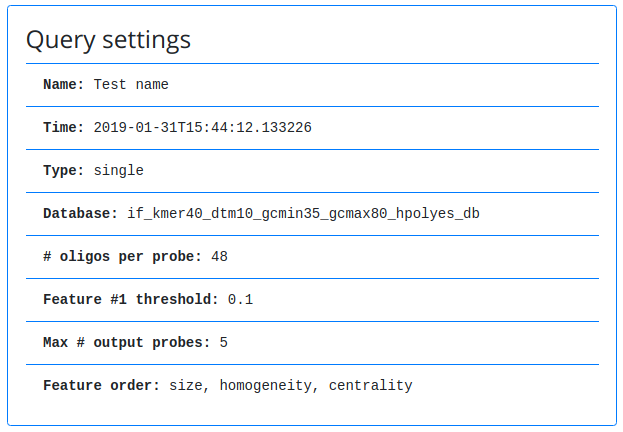
In the Query settings card, the query parameters are reported. This is similar to the Cmd card, where the command line used to run the query is shown.
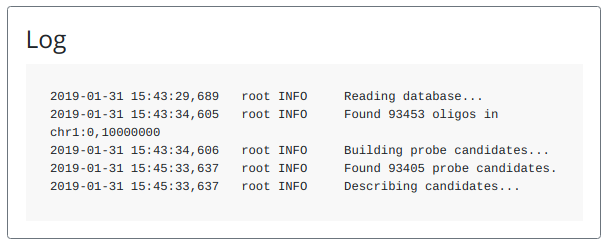
The Log card shows the query processing log. This area is updated automatically at each page refresh, and is automatically scrolled to the bottom (most recent update) while the query is being processed.
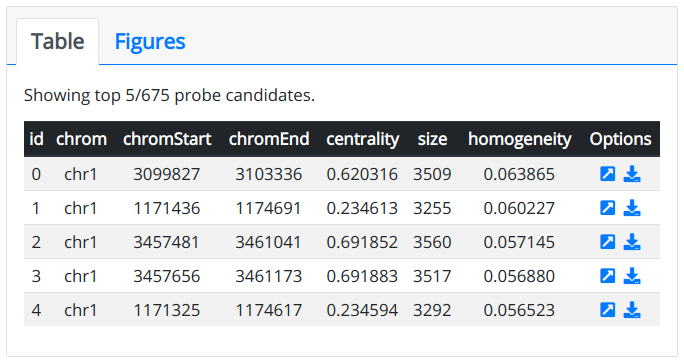
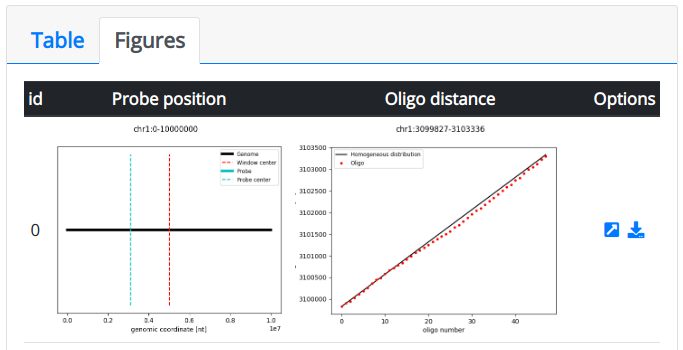
When the query has been fully processed, a new card with Table and Figures tabs appears. These report the query results, respectively in tabular and graphical format. For each candidate reported, a link is available to the candidate page, or to download it as a zip folder.
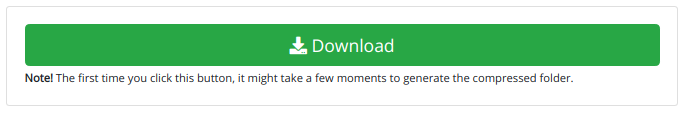
Finally, a big green “Download” button allows to download the entirety of the query results in zip format. As per disclaimer, this might take a few moments (up to a few minutes depending on the query size) to generate the zip folder.
Probe candidate page
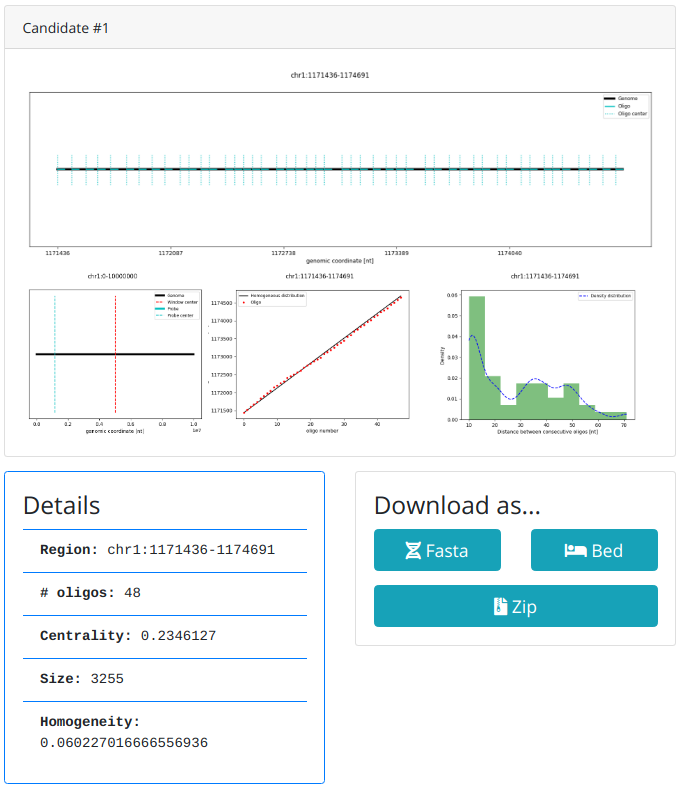
The Probe candidate page is relatively simple: graphical reports on the candidate in the first card, followed by a Details card a three buttons to download the candidate in a variety of formats.
The plots in the first card show the following:
- Top: the genomic region spanned by the probe in black, and the location of each oligonucleotide in cyan. Vertical dotted lines indicate the midpoint of each oligonucleotide.
- Bottom-left: the genomic region of interest in black and the region spanned by the probe in cyan. The vertical dashed red line indicates the region midpoint, while the vertical cyan dashed line indicates the probe midpoint.
- Bottom-center: the ID of each oligo on the x-axis, and its midpoint genomic coordinate on the y-axis. Each oligo is represented by a red dot. First and last oligos are connected by a black line. If all consecutive oligonucleotides were equally spaced, all red dots would fall on the black line.
- Bottom-right: density histogram of distance between consecutive oligonucleotides (as defined in the algorithm page).
Probe set candidate page
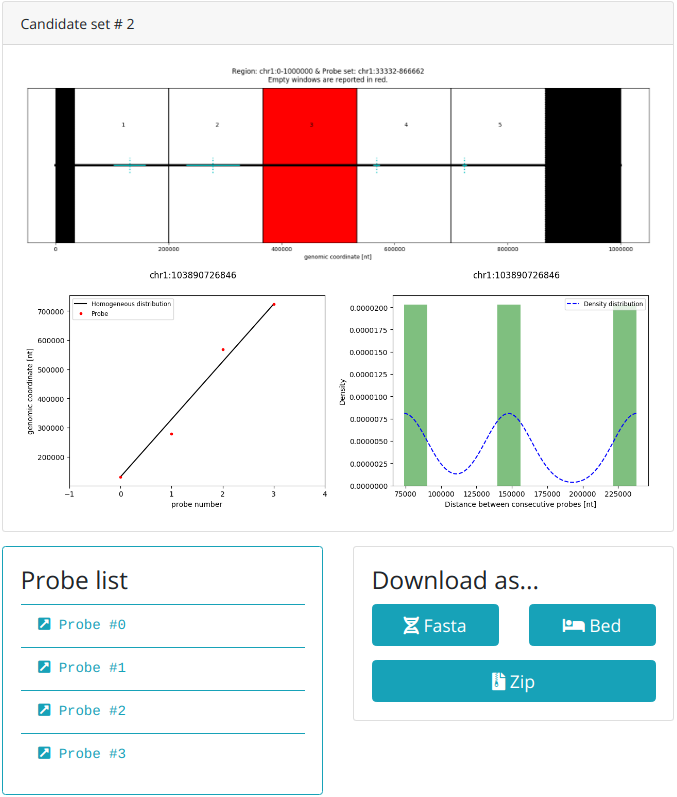
The Probe candidate page is also relatively simple and follows a similar structure as the probe candidate one: graphical reports on the candidate set in the first card, followed by a Probe list card with links to the single probe pages, and then three buttons to download the candidate set in a variety of formats.
The plots in the first card show the following:
- Top: the genomic reagion of interest is shown as an horizontal black line. Each window is separated by a vertical solid black line, and numbered. Black boxes at left/right of the region are generated by the shift. Eventual red boxes indicate windows with not enough oligonucleotides to identify a probe. Each probe is drawn as a cyan horizontal line. Vertical cyan dotted lines indicate each probe midpoint.
- Bottom-left: the ID of each probe on the x-axis, and its midpoint genomic coordinate on the y-axis. Each probe is represented by a red dot. First and last probes are connected by a black line. If all consecutive probes were equally spaced, all red dots would fall on the black line.
- Bottom-right: density histogram of distance between consecutive probes (as defined in the algorithm page).